 Global equities built on a strong second quarter rally in July. Despite a late July rate hike by the Federal Reserve, investors shifted their focus from worries about inflation to hopes for the elusive “soft landing” for the economy. Second quarter earnings reports have been strong, giving fuel to the stock market bulls.
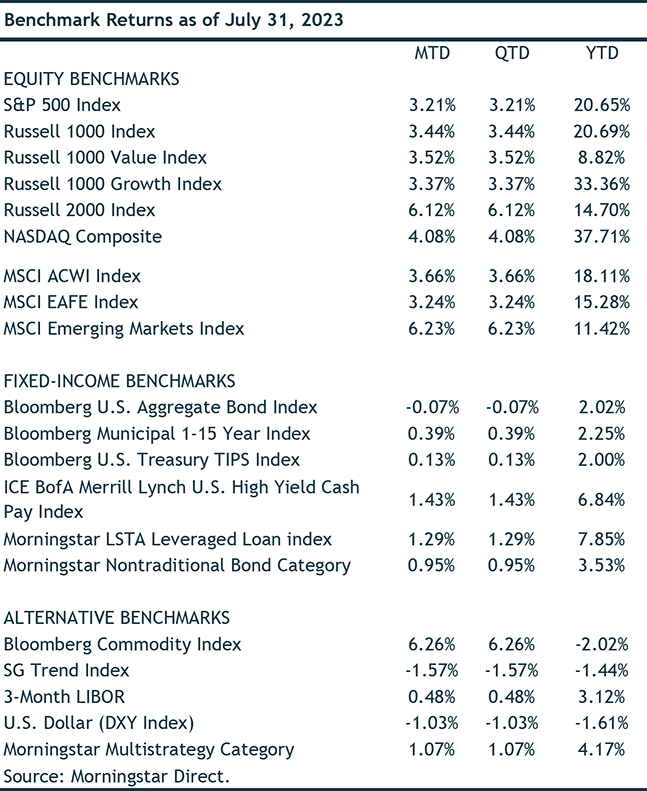
The S&P 500 index gained 3.2% in July, driving its year‐to‐date return to more than 20%. The mega caps stock obsession with AI related names continued to drive the NASDAQ higher, although we did finally see market participation broaden evidenced by small caps outperforming tech and large cap names in July.
The Banking Crisis
The market’s strong results for the past four months were particularly noteworthy as they took place in the shadow of the March banking crisis. After the immediate panic associated with the failure of Silicon Valley Bank, the markets steadied as the policy response from the Fed seemed to calm investors. We would note, however, that the issues we raised at the end of March remain very much in play even if they aren’t getting much attention. Specifically, we remain concerned about three key issues:
- The ability and willingness of banks to lend (arguably the key function of a bank) has diminished significantly. This, on a lagged basis, will adversely impact the economy. The question is when and how badly.
- The slow‐motion loss of deposits at banks, which Jim Bianco has described as a bank walk rather than a bank run, continues as investors seek higher returns from cash. We have noted that many banks have started offering much more attractive returns on cash to compete with money market fund and Treasury bill yields, this will adversely impact bank profits.
- The unrealized losses on bank bond portfolios, which resulted from Fed rate hikes, haven’t been solved and in fact are getting worse as interest rates have turned back up and the Fed has signaled more work to do on the inflation front.
We aren’t suggesting that a replay of March is at hand, but it is also likely too early to be too comfortable about the regional banks. While the burgeoning private credit industry may replace some of the lending of banks, the notion that it is difficult to have a bull market without the participation of financials remains a valid concern until proven otherwise.
The Bullish Case
Rarely have we seen such a wide dispersion of views about the economic and market outlook. To paraphrase Yogi Bera, it is hard to make predictions, especially about the future. Strategists and investors seemed to have realized the truth in this bit of folk wisdom. While acknowledging the challenge, we thought it best to highlight the bull and bear cases for the markets.
For the bulls, inflation that got out of hand led to interest rate hikes that forced the Fed to raise interest aggressively beginning in March of 2022. Those interest rate hikes kneecapped the equity markets and led to a miserable 2022 for both stocks and bonds. Despite those rate hikes, however, the US economy has continued to grow and create jobs. For investors, of greatest significance, is that corporate earnings have remained resilient. With stocks having recovered most of their bear market losses, optimists see clear room for further gains.
As we ponder the bullish argument, we would note that in both the economy and the markets, periods of change in the narrative are the most disruptive. In 2022, the transition from a low inflation, stable interest rate regime to a high inflation, raising rates regime, was traumatic. In the long view of economic and market conditions, however, the current environment isn’t too bad. 4% inflation (and currently declining), 5% cash yields and 7% mortgage rates seem very benign compared to periods of much higher rates for all of those measures. Essentially, the trip from where we were economically to where we find ourselves today was difficult, but the destination doesn’t seem bad.
Central to the bullish argument is that inflation measures have come down sharply from their highs a year ago. By any measure, from CPI to the Fed’s look at core inflation, price pressures are falling. Although they have yet to reach the 2% target of the Fed, they are heading in the right direction. That simple fact has allowed the Fed to slow its pace of rate hikes (which were running at 75 basis points every meeting to 25 basis points this spring) and then to hike modestly in July after the May pause. Many investors believe the Fed is now done. For forward‐looking investors, this would be the relief they need. Even if rates don’t fall from current levels, the fact that they might not get worse is cause for celebration.
Despite more than a year of rate hikes, the US economy has remained resilient. It is hard not to be impressed by the strength of the job market. Although the pace of job growth has slowed, the most recent reports of more than 200,000 jobs being created last month, with a resulting unemployment rate of 3.6%, suggest that momentum is strong. Even interest‐sensitive sectors like housing have not only held up but actually prospered. In just the past two weeks, both homebuilders and airlines, two notoriously economically sensitive sectors, have reached new highs. That is clearly a bullish, rather than economically bearish, sign.
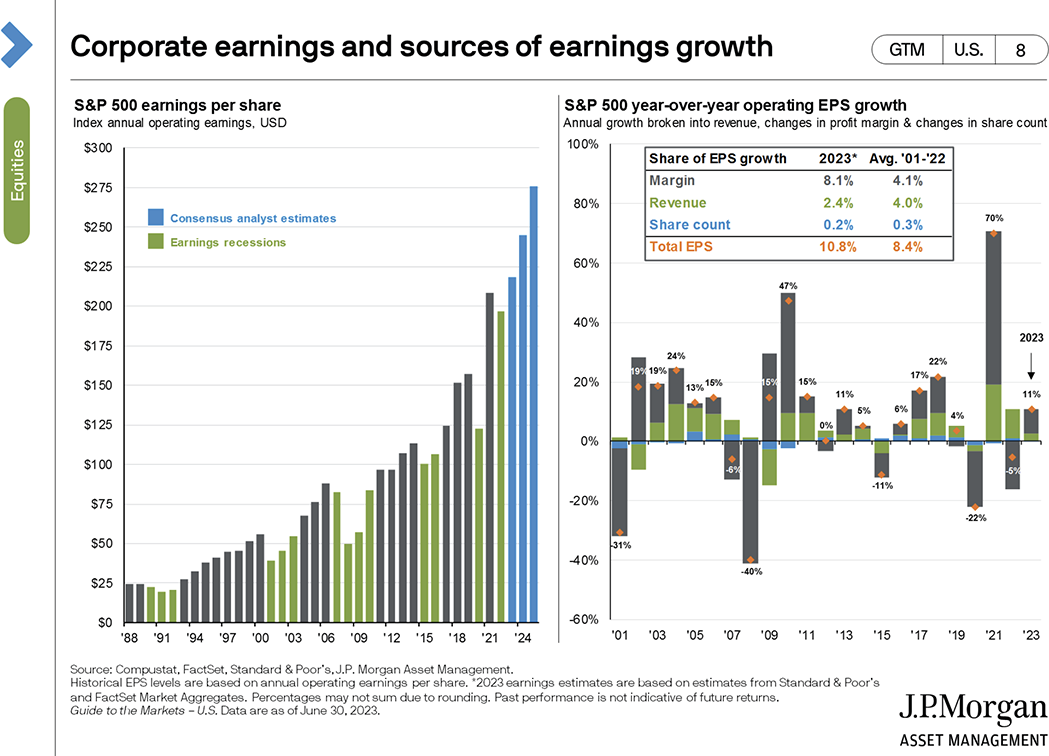
Of greatest note is how strong corporate earnings have been. Despite widespread fears of a sharp fall off, companies have managed to pass along higher costs and maintain profit margins. This is the mother’s milk of equity investing. If earnings growth can continue, markets will almost certainly move higher.
The Bearish Case
For more cautious investors, the bearish arguments are the mirror image of the bull’s case, with a dose of skepticism about market valuations and concentration added for good measure.
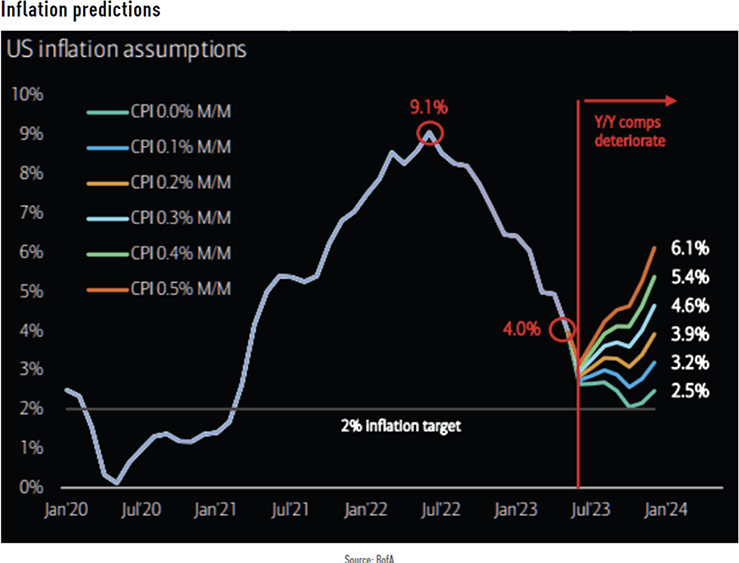 Our challenges began with the breakout of inflation, and no one denies that measures of price pressures have come down. The $64,000 question is where do we go from here? It seems that we are nearing a trough in inflation measures. Of greater concern is that inflation seems likely to move higher from current levels in the second half of 2023. As Bank of America highlights in the chart, we would need zero monthly inflation to get to year end at a 2.5% CPI annual rate of increase. This is unlikely without a recession, and even if it came to pass, CPI would still be above the Fed’s 2% inflation target.
If inflation hasn’t been vanquished, investors may look back on the Fed’s June “pause” as yet another policy mistake. The rate markets have already responded as rates across the yield curve have moved up. Some of that increase is driven by ongoing market strength, and some of it is driven by the news that one of the major credit rating agencies, Fitch, downgraded the US Government’s debt to AA status. This news probably didn’t lead to many direct bond sales, but a reading of the Fitch report is sobering. Our government is on track for massive deficits this year, at a time of peace (notwithstanding support for Ukraine) and low unemployment. With interest costs set to exceed $1 trillion in the coming year, the case Fitch makes is that we are on an unsustainable fiscal path. That is hard to argue with but the timing remains the question.
As noted earlier, more rate hikes will pressure banks even more. The bigger issue, however, is that further rate hikes are likely to continue to further invert the yield curve. The yield curve describes the relationship between interest rates and maturity dates. In a normal environment, long‐term interest rates are higher than short‐term rates to compensate for the risks of tying money up for a longer period. When the Fed begins to raise rates, you can see an inversion where short‐term rates come to exceed long‐term rates because investors collectively assume that, eventually, higher short‐term rates will cause a recession and lead to interest rate cuts.
There has been no other economic signal that has been more accurate in predicting recessions than the inverted curve. While there are many different yields to consider in making your comparison, the Fed prefers the 10‐year bond less the 3‐month T bill. A meaningful and durable inversion has never failed to predict a recession with an average lag from initial inversion to recession being just over 300 days. That would suggest a recession starting in October. Of equal worry is that the depth of this inversion is particularly large:
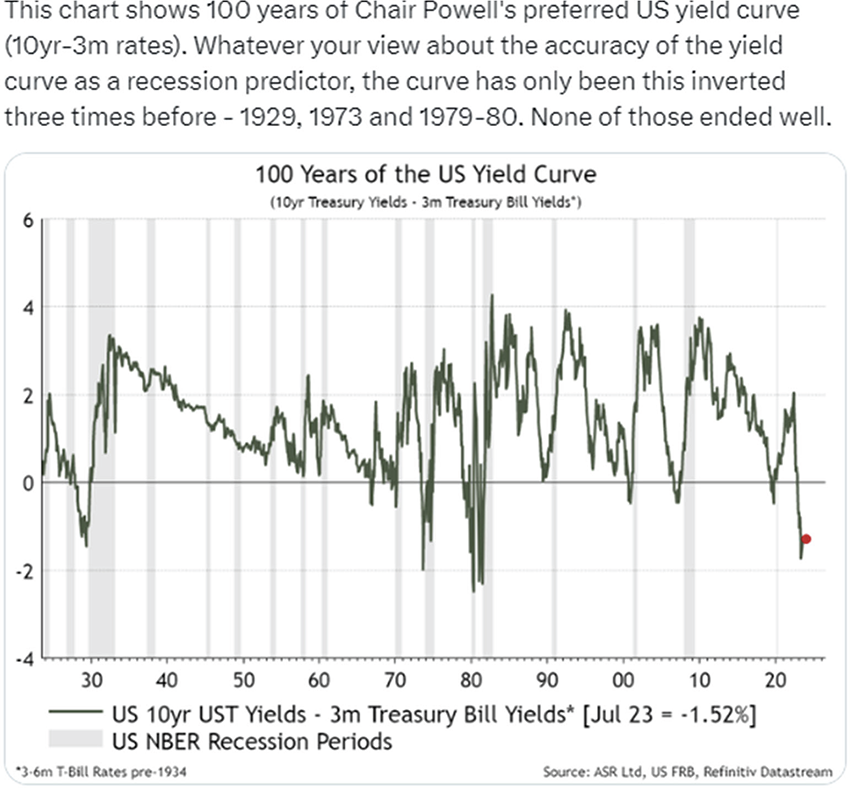
History doesn’t repeat but it does rhyme and this rhyme is cause for worry. If we do move toward a recession, history shows that those strong corporate earnings that have been so supportive of stock prices will weaken. We are in agreement that it is hard to conceive of a severe recession given the employment picture, but lower earnings would clearly lead to a market pullback.
Corrections are part of investing and aren’t to be feared. They can become bigger issues, however, when they begin from high valuations. The current market suffers from relatively high valuations, particularly for the large‐cap tech stocks that have led the market higher since the failure of Silicon Valley Bank and the excitement about artificial intelligence as an investment theme. While we believe that AI is an exciting development, we may be ahead of its impact on the markets. Regardless, there can be no doubt that the largest tech stocks have assumed an outsized part of the market while their earnings haven’t kept pace:
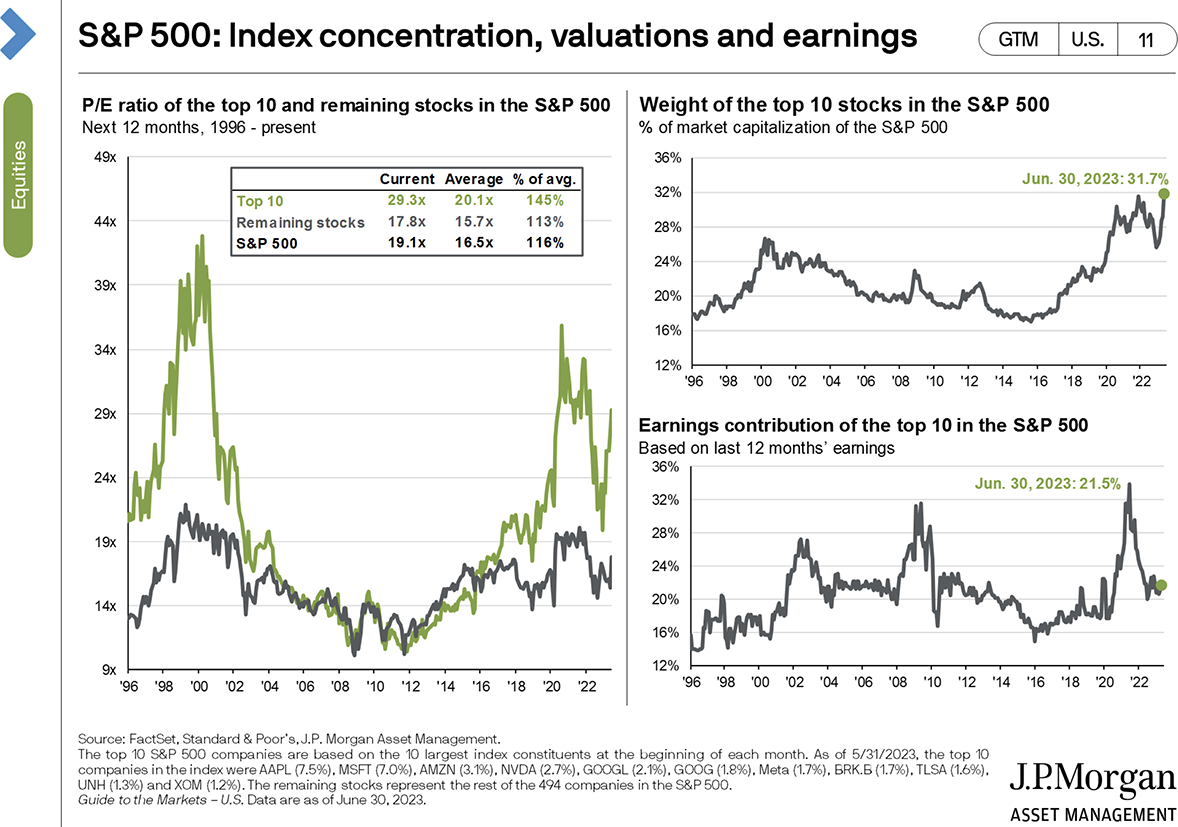
This disparity will not last. Past episodes of market concentration have been resolved by weaker performance for the market darlings and stronger performance for the laggards that have more attractive values. We suspect this will play out similarly.
At the risk of seeming like we are picking on a name, we wanted to highlight chip marker Nvidia as the poster child for valuations that are, charitably, stretched. As the chart below highlights, Nvidia is in a league of its own when it comes to one of our favorite valuation metrics, the price‐to‐sales ratio:
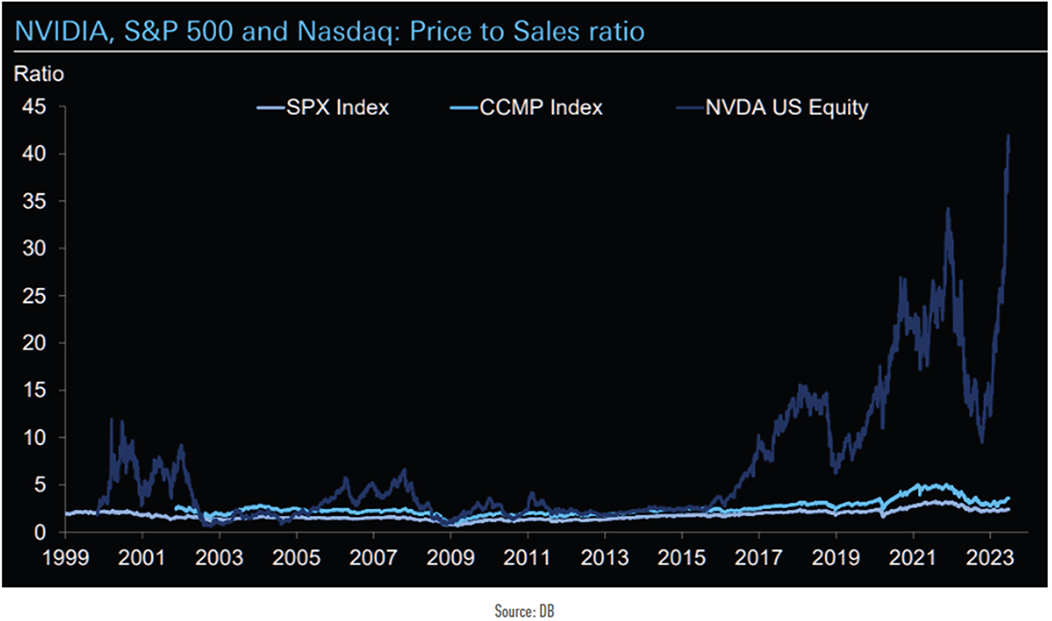
As the share price, and resulting PS ratio rose this year, we often found ourselves describing the phenomenon to anyone who would listen. Our astonishment was usually greeted with nods of understanding but absent some context, a price‐to‐sales ratio of more than 40 times doesn’t mean much. The best description that we have ever seen of the folly of a high price‐to‐sales ratio came during the dot com boom from Scott McNealy, then CEO of Sun Microsystems (arguably the Nvidia of its day). When his stock reached a price‐to‐sales ratio of 10 times, he pointed out the following:
‘At 10 times revenues, to give you a 10‐year payback, I have to pay you 100% of revenues for 10 straight years in dividends. That assumes I can get that by my shareholders. That assumes I have zero cost of goods sold, which is very hard for a computer company. That assumes zero expenses, which is really hard with 39,000 employees. That assumes I pay no taxes, which is very hard. And that assumes you pay no taxes on your dividends, which is kind of illegal. And that assumes with zero R&D for the next 10 years, I can maintain the current revenue run rate. Now, having done that, would any of you like to buy my stock at $64? Do you realize how ridiculous those basic assumptions are? You don’t need any transparency. You don’t need any footnotes. What were you thinking?’ — Scott McNealy, Business Week, 2002
Our observations about tech stocks in general and Nvidia in particular aren’t meant to suggest that the market is to be avoided. As we know from years of being premature in decrying high values for stocks, the market can remain irrational far longer than anyone can believe. Instead, remaining vigilant about risk management and seeking value remains critical to long‐term success. On balance, we remain cautious but hopeful.
Up Next...

